7. Manager Level - Call Center Feature - Agent Performance tab
After you click the “Begin Session” button, the session will start and the Queues tab will appear in the main space of the app.
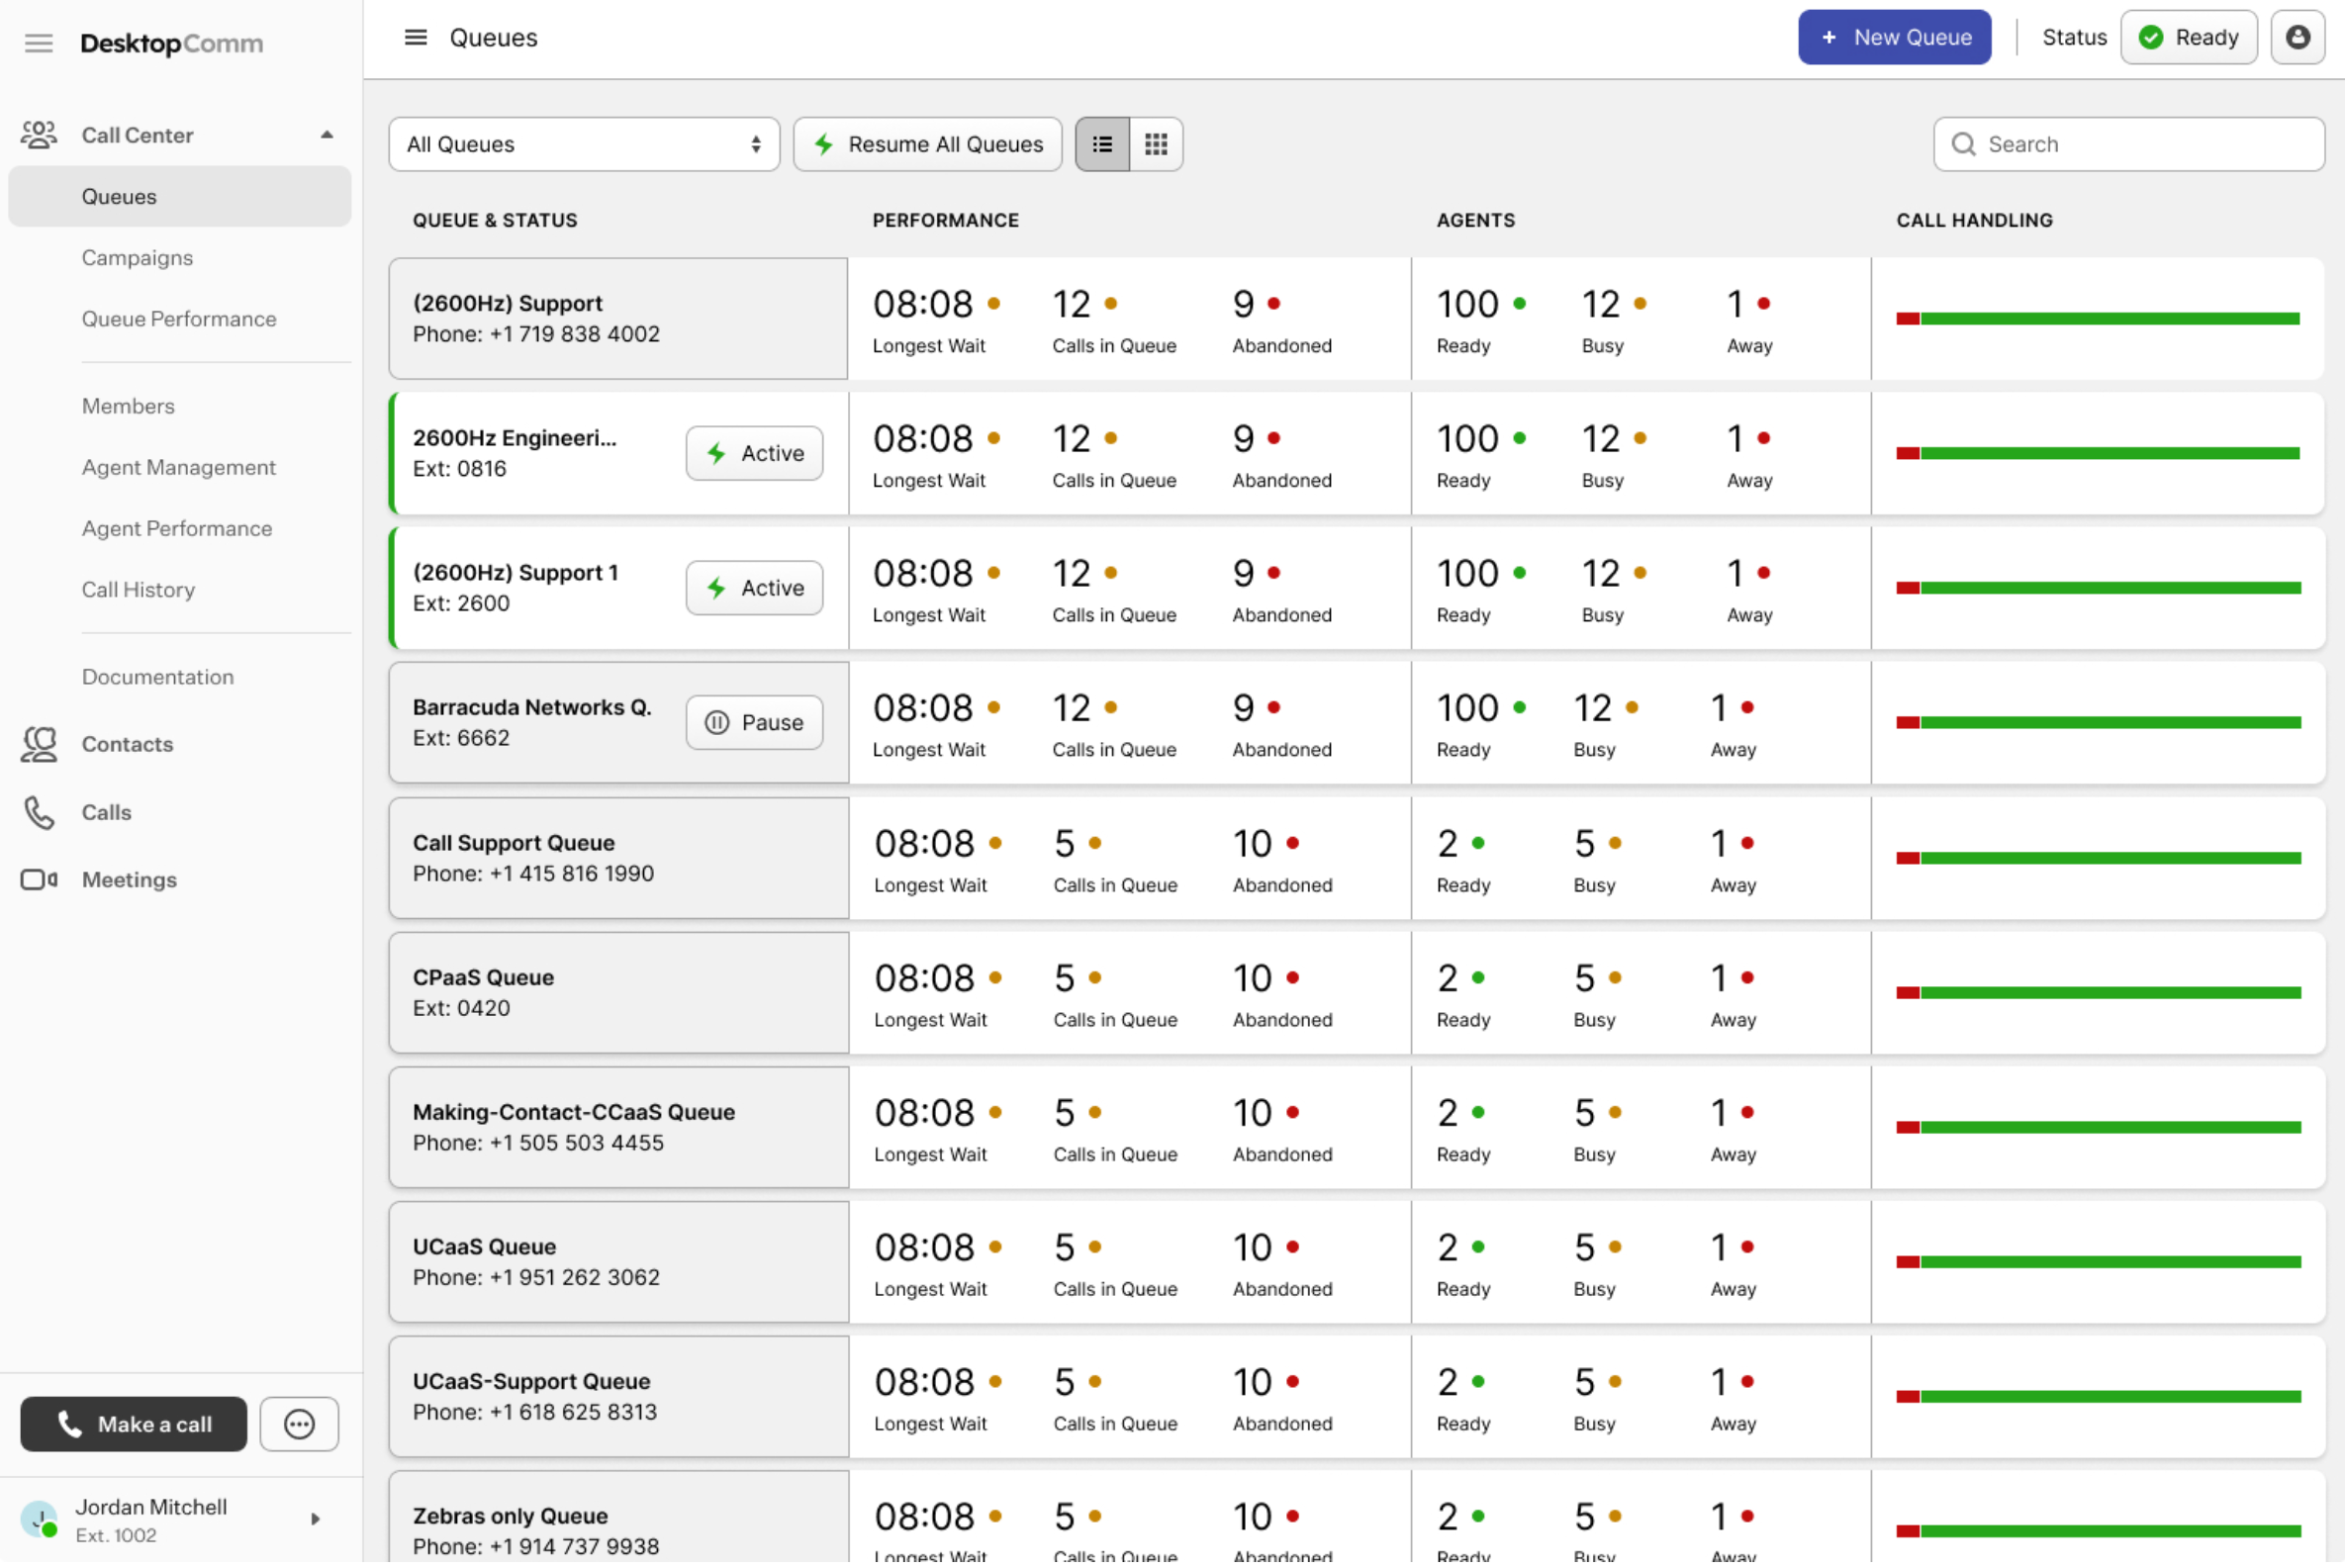
Click the Agent Performance tab in the left-hand menu of the portal to open the corresponding section of the Call Center.
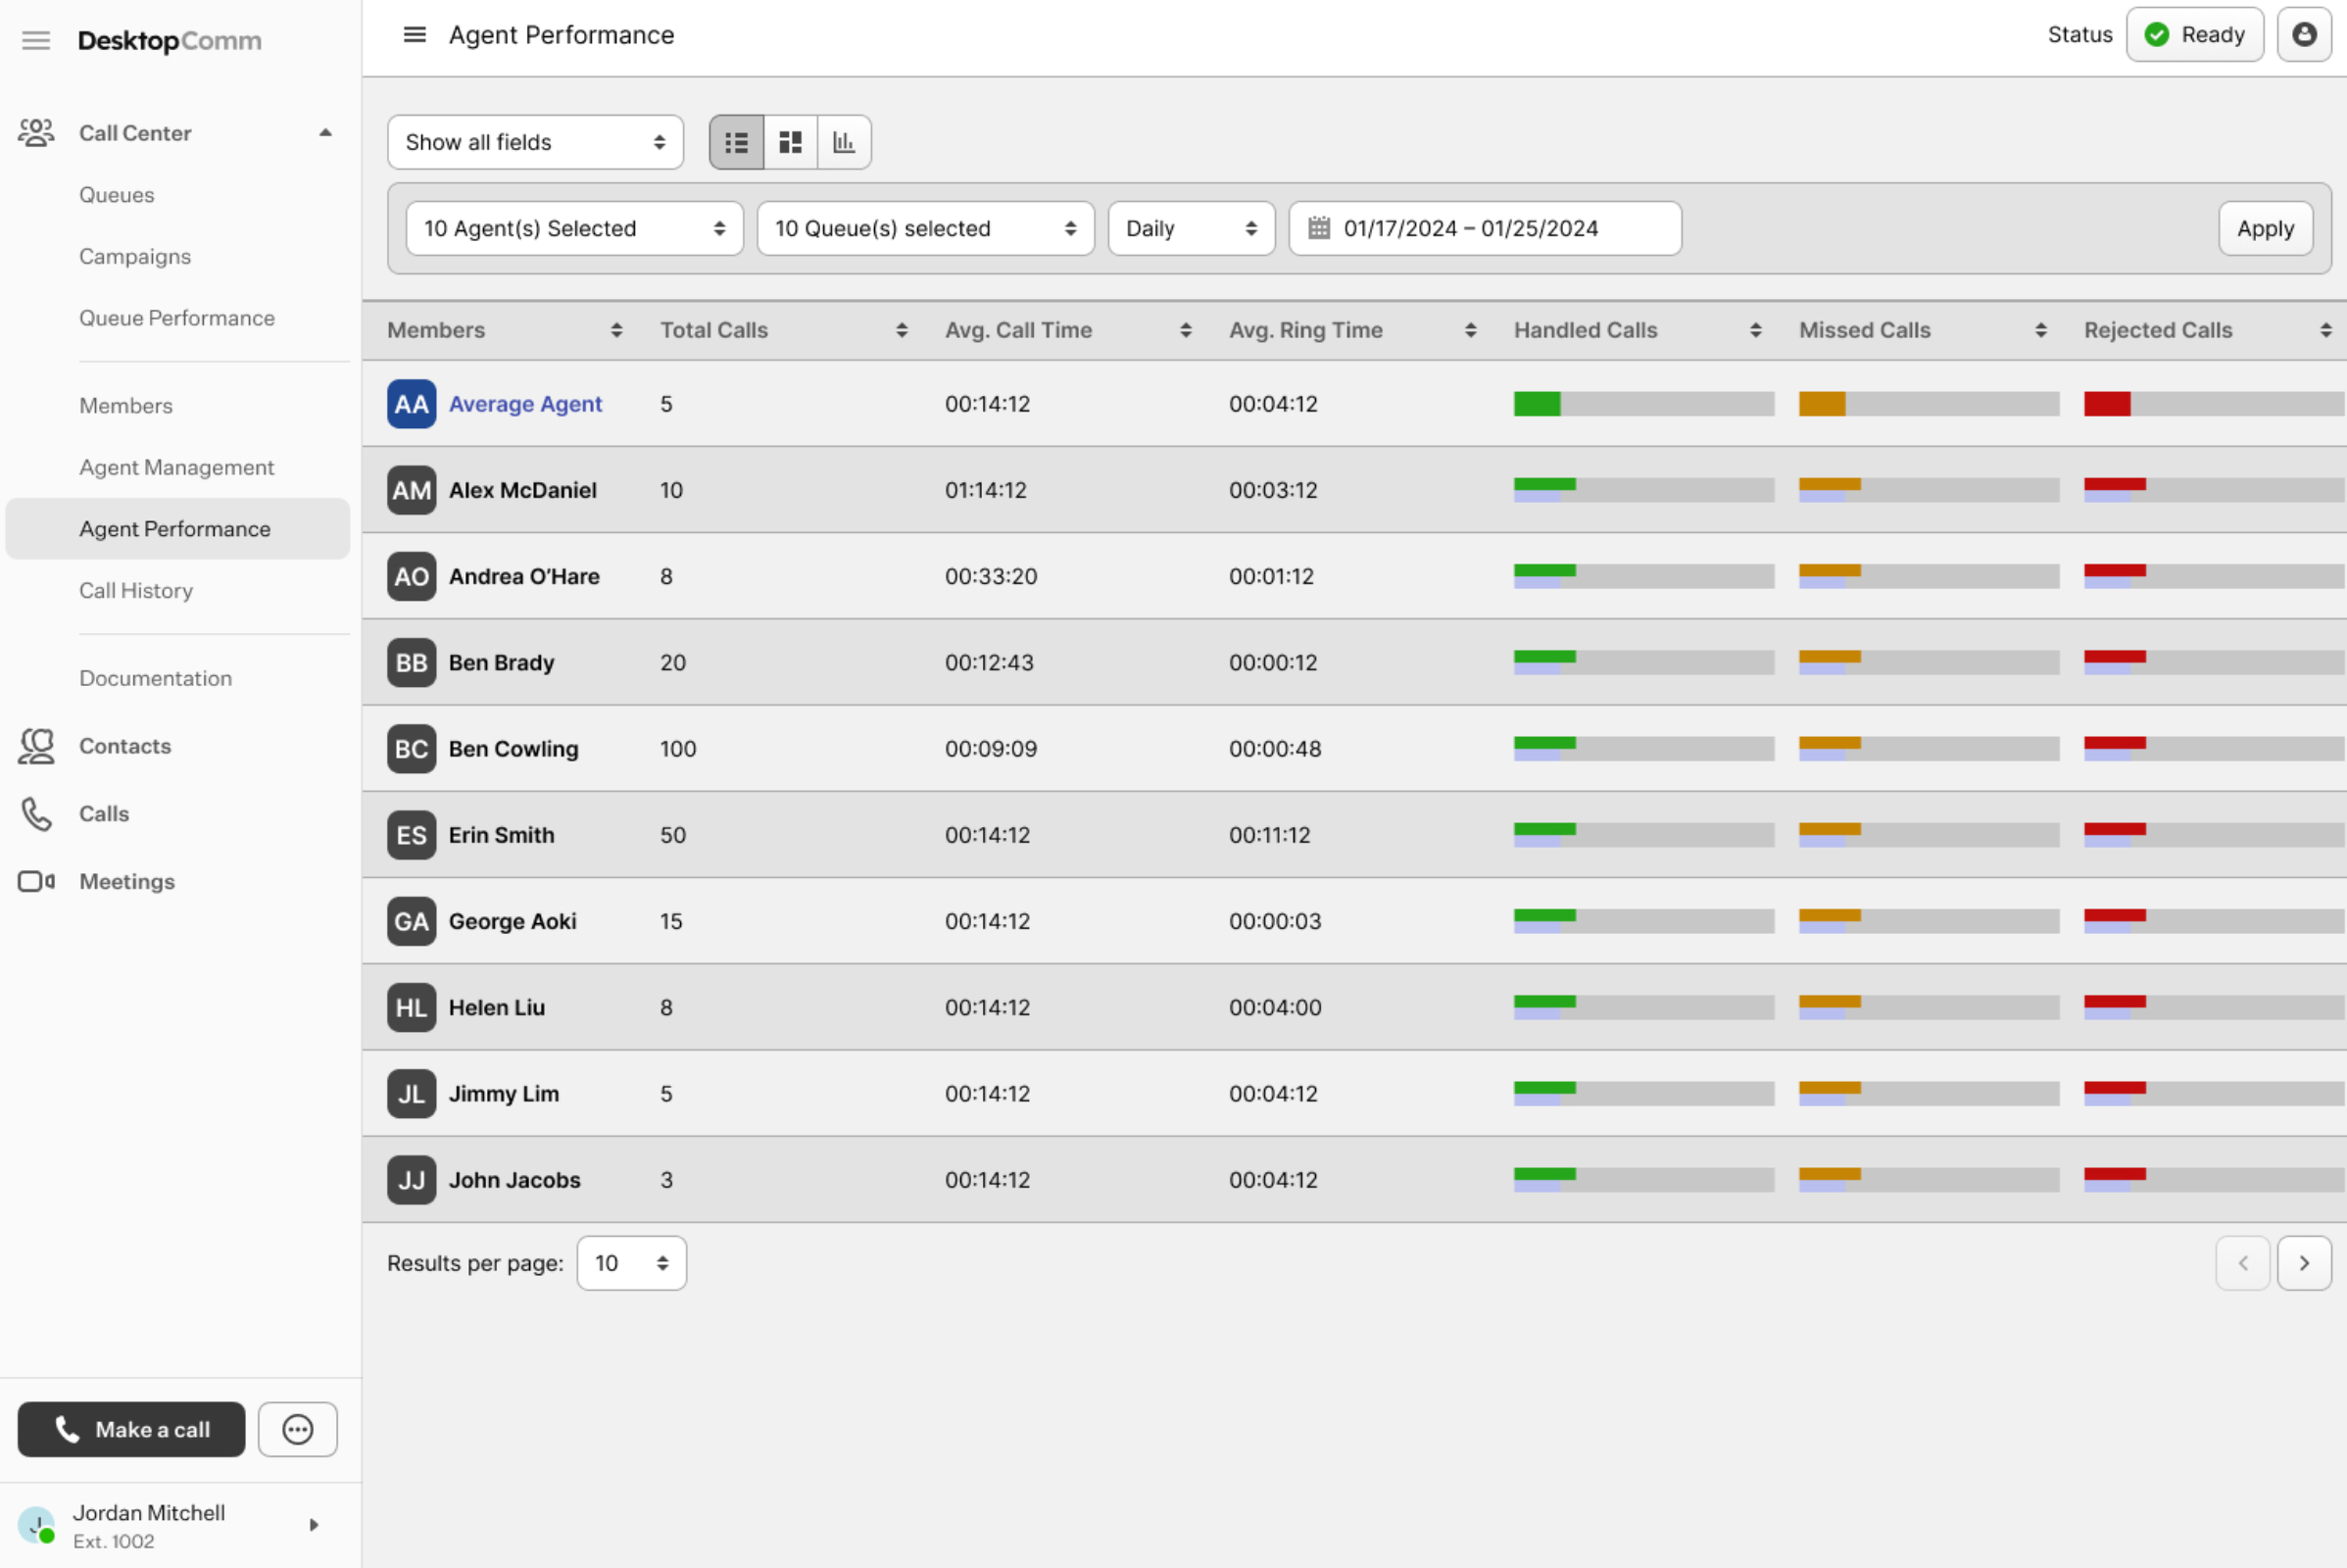
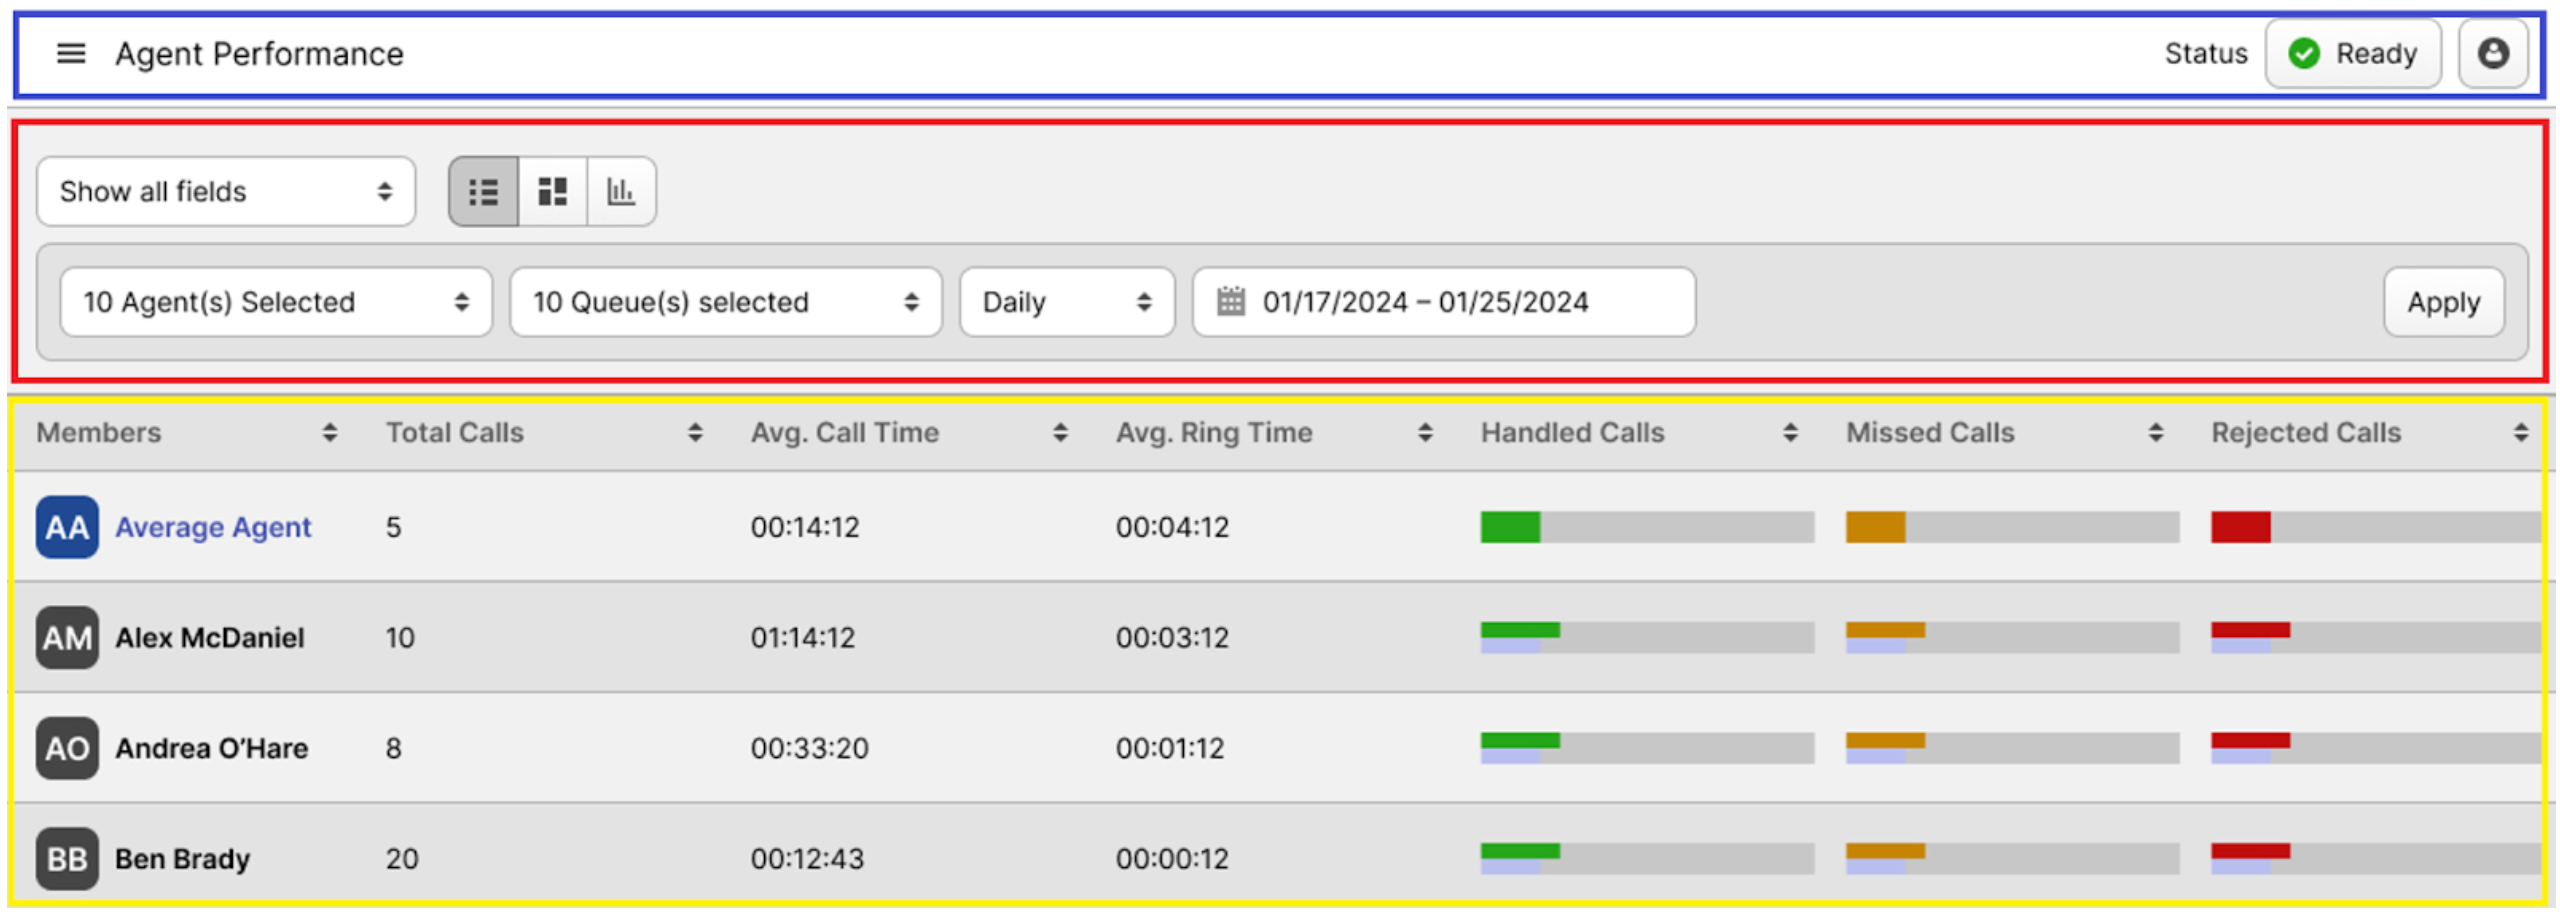
The interface of the Agent Performance tab can be divided into three primary sections:
-
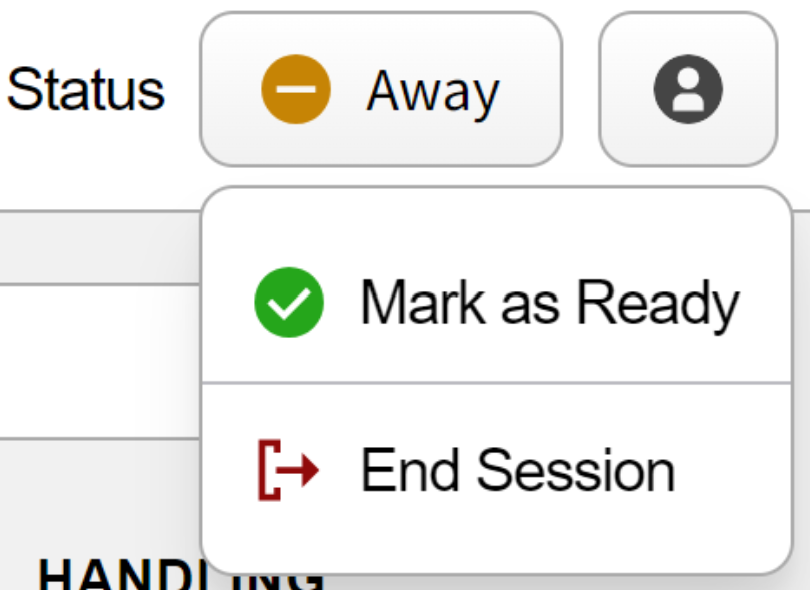
Agent Performance Status Bar (blue rectangle): this bar allows you to control the status of the your session.
-
The status button lets you update your account’s status. Clicking it opens a drop-down list with options such as “Ready,” “Away,” or “End Session.”
-
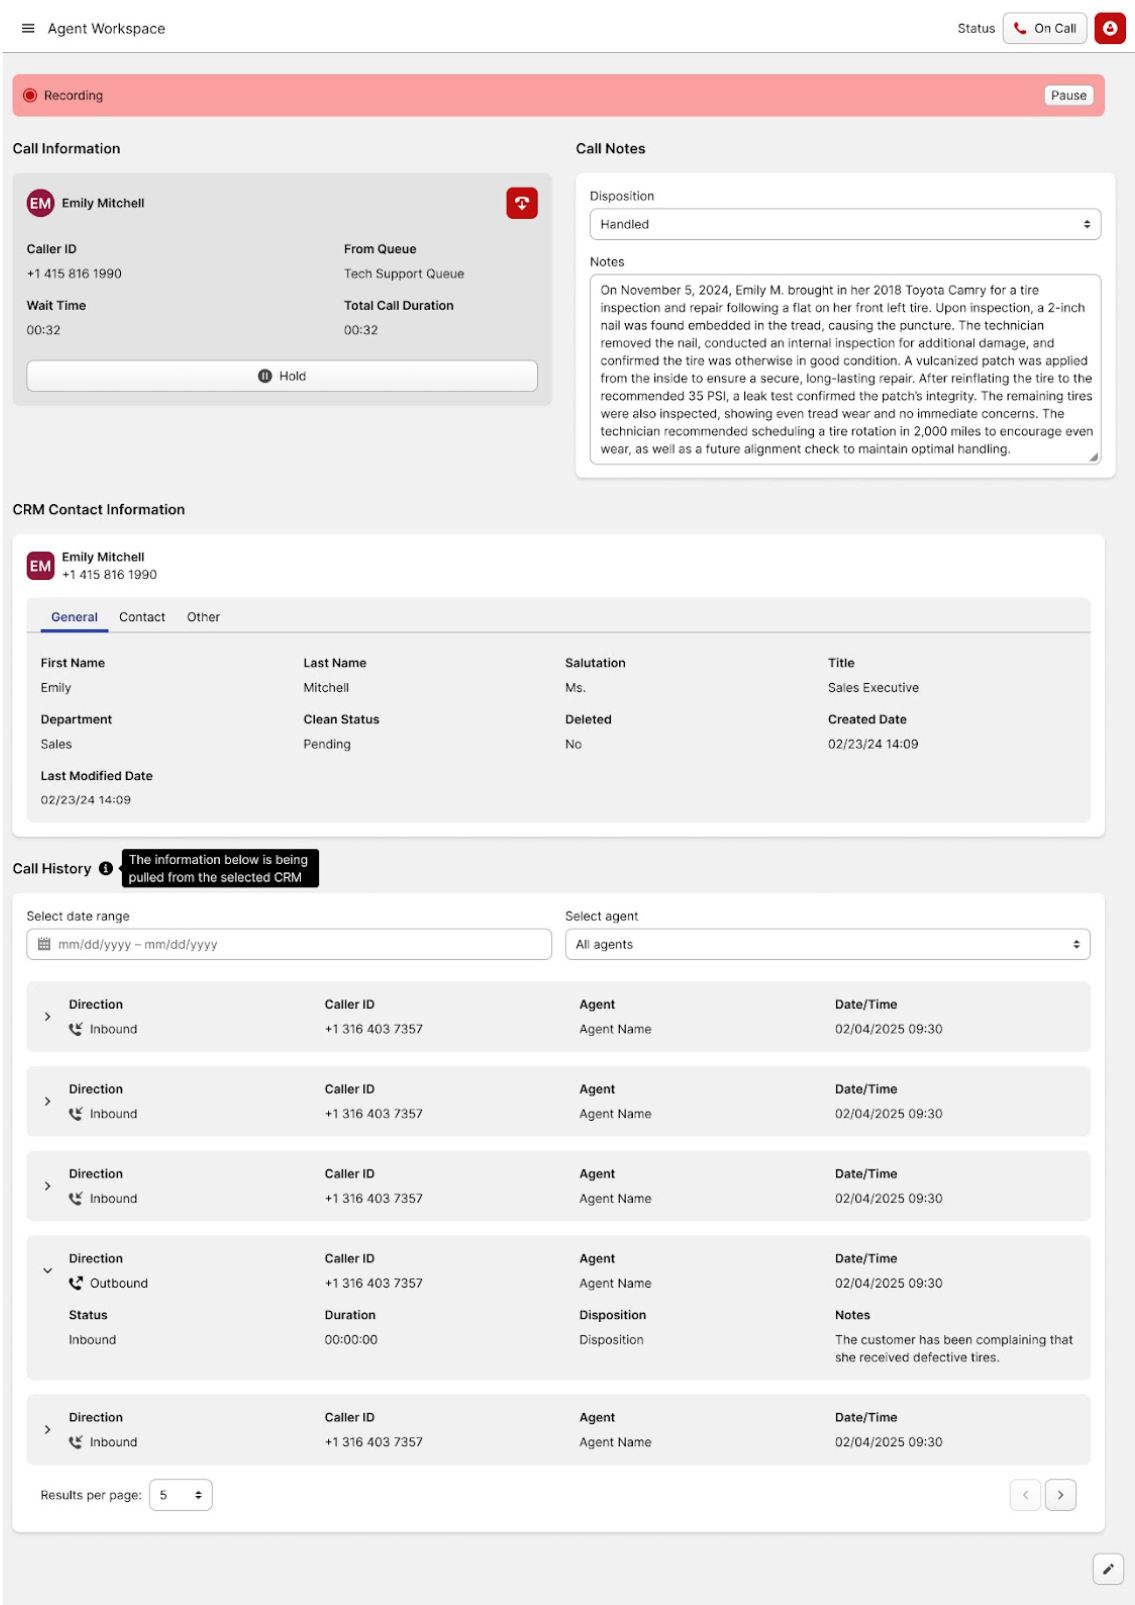
The button with the human icon provides access to the agent workspace, where you can enter call details, notes, and other related information.
-
-
Action Bar (red rectangle): this bar contains all the action controls used to sort queues, switch the view, and pause or resume all queues simultaneously.

-
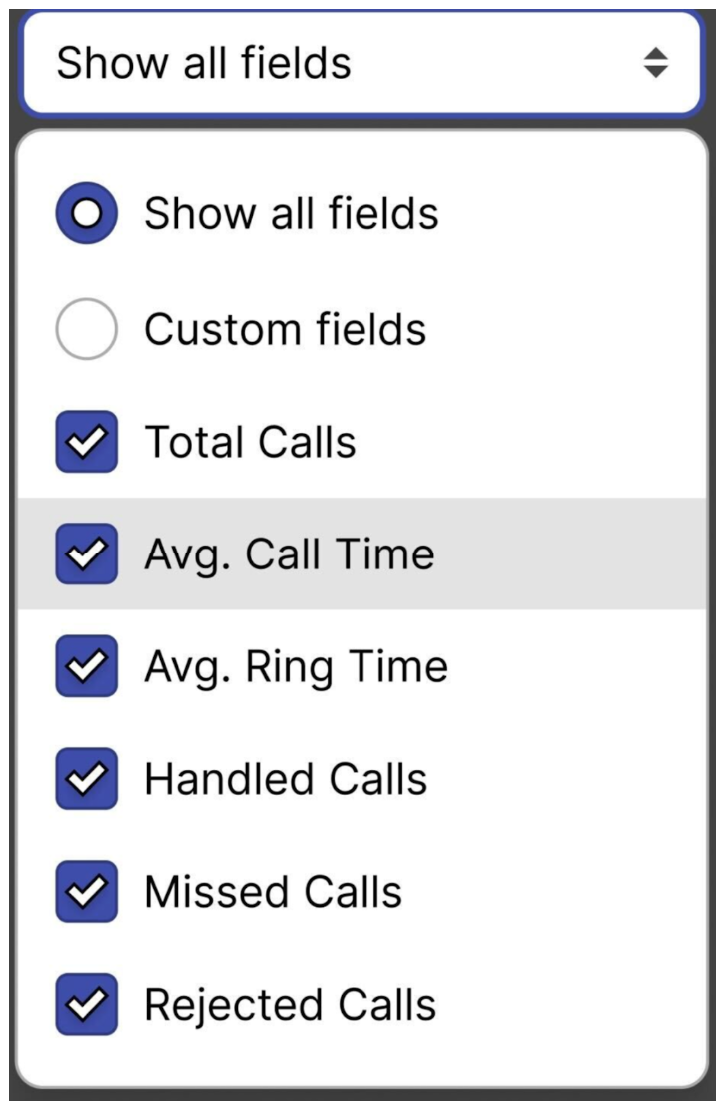
Fields Visibility: clicking this field allows you to select what fields to be shown in the following list of agents.
-
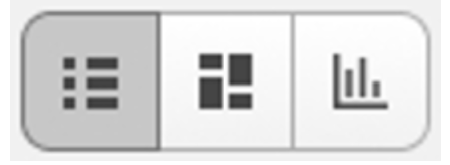
List / Grid / Graph View: clicking this button will change the way all agents’ performance data is displayed on the page.
-
Filter: this section serves as a filtering tool that lets you view a specific set of agents based on a selected time range.
-
-
Agent List (yellow rectangle): each agent in the section is displayed as a record in the table. Depending on the selected View, they will be displayed differently. Each line contains useful information such as the agent name and its performance metrics.
This tab is intended solely for viewing performance metrics and does not provide any configuration or management options.